

Finding out the impact of advertising should be easy: “Did showing my ads affect customers’ behaviour, relative to not showing my ads?” We have developed a technology that facilitates this simple comparison by identifying users who would have been exposed. These are the control-group counterparts of the exposed users in a randomised experiment. In this article, we’ll discuss advantages of this technology over other experimental methods and its importance for attribution modeling.
A recent article here on Think with Google discussed how to measure true marketing impact using controlled experiments. In this article, we dive deeper into the challenge of running online ad experiments that are accurate and precise.
The Challenge of Measuring Ad Effectiveness
Many advertisers think that evaluating the impact of advertising is easy - you just compare the outcomes from one campaign to another, right? Unfortunately, simple or even more complex attribution modeling comparisons don’t always give the proper credit to the ads: not all correlations are causal. Experiments involving treatment and control groups represent the scientific gold standard in finding out what works and should play an important part in an advertiser’s attribution strategy. So, what is the ideal advertising experiment?
Features of Accurate Ad Experiments
A scientific advertising experiment has two main features: a well-defined target group and precise control over who is allowed to see the ads. An ad campaign never reaches all users within the target audience because whether a user sees a particular ad depends on their behaviour, competitive bidding among advertisers, and numerous targeting parameters. As a result, the users reached can differ radically from those not reached. To measure advertising effectiveness, we want to make a simple comparison, “Did showing the ads change users’ behaviour, relative to not showing them?” To do so, we randomly divide our target users into two groups: we try to show ads to one and withhold ads from the other. In scientific speak, this creates a treatment group with actually exposed users and a control group with users that we would have exposed but chose not to. This is the easy comparison of exposed versus would have been exposed users.
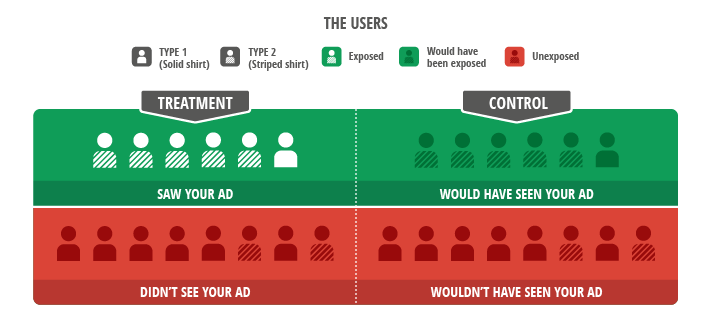
Figure 1: The Ideal Experiment Compares Exposed and Would Have Been Exposed Users. Users differ in their purchasing behaviour, illustrated using Type 1 (solid shirt) and Type 2 (striped shirt) users. The groups we wish to compare must contain the same mix of users. Otherwise, we compare “apples to oranges." A scientific advertising experiment takes a set of target users and splits the reached users (green region) into balanced treatment and control groups. We would like to compare the actions of these treatment users (in white) with their control group counterparts (in grey). But how can we identify the users who would have seen the ads?
Approach 1: PSA/Placeholder Campaigns
Now, you may be thinking, “I know about placebo testing, it’s easy. I just split my targeting list in half and set up a second campaign with a placeholder ad that is unrelated to the advertiser - such as an ad for a charity (i.e., public service announcement or PSA).” Under cost per mille (CPM) pricing and a very simple ad server, this can work but comes with a media cost of the placeholder ads to the advertiser or publisher. However, modern ad servers using cost per click (CPC) and action (CPA) pricing and creative optimisation distort these so-called “PSA tests.” For example, if the ad network chooses to show ads that generate higher revenue more often, any difference in click-through rate (CTR) between the advertiser’s ads and the placeholder ads will cause the creatives with higher CTRs to be shown more often. Further, the ad network will show ads to the types of users that are most likely to click. And the users who choose to click on an ad for sporting goods or apparel are likely to be quite different from those who click on an ad for a charity - leading to a comparison between “apples and oranges.” Hence, such PSA testing can lead to wrong results ranging from overly optimistic to falsely negative.
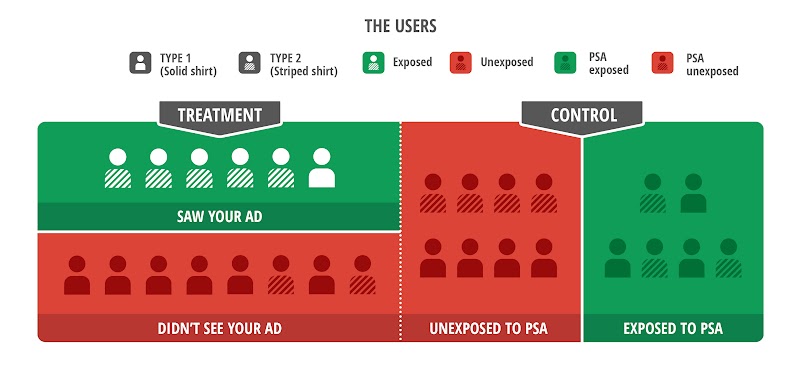
Figure 2: PSA Tests Fail in Modern Ad Systems. Ad networks treat the advertiser’s creative and PSA differently. Here, the ad server’s optimisations cause the PSA to reach a different group, leading to unbalanced exposed and PSA-exposed groups. An analysis comparing users in the treatment and control groups’ green regions will be invalid: note that the treatment group’s six reached users include five striped-shirts but the control only has three. Measured differences in conversion behaviour may now be more driven by the different mix of user types than by the effect of the advertisement.
Approach 2: Intent-to-Treat
There is another way to analyse experiments without a placeholder ad campaign: just ignore all exposure information in both treatment and control groups. For example, if we randomly divide our target audience into two lists and show ads to only one, we can compare the behaviour of all users, not just those who saw an ad, between the two lists to measure the causal effect of the advertising. By comparing all users, regardless of their opportunities to see the ads, we still properly compare the exposed with the would have been exposed users but end up clouding the comparison with added noise from those users who were not or would not have been exposed. This method - called “intent-to-treat" - is scientifically clean, comparing apples to apples. But the added noise of including unreached users that were not really part of the experiment is often quite large, leaving us wishing for a better solution.
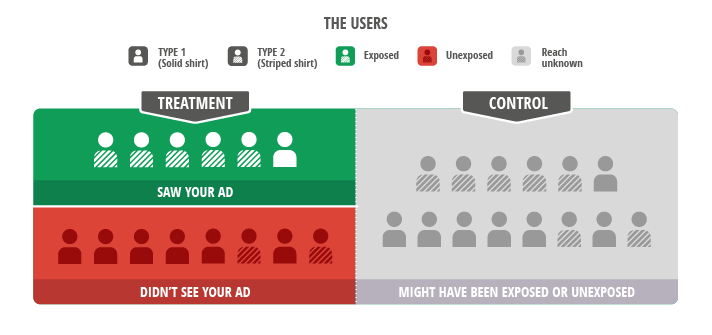
Figure 3: “Intent-to-Treat” Ignores Exposure Information. The scientifically clean comparison is across all treatment and control users. This balanced “intent-to-treat” comparison includes noise from the unreached users in the red region whom we intended to reach and their control group counterparts. These control users who would have been exposed are somewhere in the grey region, but we do not know where. Yet, if we compare the the whole treatment group (green and red) with the control group (grey), the user mix is unchanged and allows for a fair comparison.
Ghost Ads: An Ideal Solution for Ad Experiments
The ideal solution combines the best of both worlds: apples-to-apples comparisons on users who were actually reached by the advertiser’s campaign. We call this technology “ghost ads.” Ghost ads record when we wanted to show the ad, ensuring that control group users who would have been exposed are comparable to the actually exposed treatment group users. By not using two separate creatives, the ad server handles treatment and control users identically even under CPC or CPA pricing, avoiding the distortions that plague PSA tests. And, since it allows filtering out users that did not have a chance to see the ad, ghost ads let us measure undistorted uplift effects with a precision that exceeds that of intent-to-treat by up to 50 times.
Ghost ads have additional benefits. First, neither the advertiser, the ad network, nor the publisher incurs the cost of serving PSAs. Second, with a costless control group, more complex and informative experiments can be designed. Third, rather than comparing the advertiser’s ad with an irrelevant artificial ad, the experiment measures against the relevant competitive baseline: would have been exposed users see whatever ads naturally appear when the advertiser turns off the ads. Fourth, Ghost ads that record when the user sees the ad (e.g., ad viewability) help us discard the noise from users who were delivered an ad but did not actually see it.
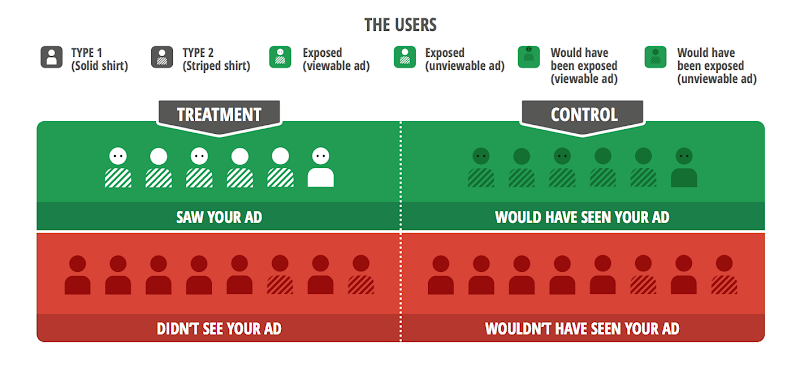
Figure 4: Ghost Ads can be Further Enhanced by Ad Viewability Information. Ghost ads allow us to record which users would have been exposed and other exposure-related information such as ad viewability for the ghost ads to further improve measurement. The best ad effectiveness comparison would be to compare the users in the green region whose ads were viewable (i.e., with eyes).
Looking Ahead
Building the ideal is not easy. As with PSA testing many pitfalls can arise. New technologies such as ad viewability, real-time bidding, retargeting/remarketing, and user personalisation add engineering complexities and require rigorous validation. Google is known for investing in new technologies, and ghost ads is one of them. A case study with DefShop, a European online specialty clothing retailer, demonstrates this new advertising measurement solution.
Ghost ads will help validate and improve existing attribution models and create a revolution in advertising effectiveness measurement. We hope the industry will embrace ghost ad experiments as a key technology in evaluating and optimising ad spending.