


Michał Protasiuk is a researcher at Google. His focus is on how brands can measure the impact of their media spend in a more robust and holistic way.
It is a challenging climate as 42% of marketers expect their budgets to be lower this year. The pressure to prove incremental value has reached a tipping point yet, for many, the tools to do so remain elusive.
While 71% of marketers report a greater focus on effectiveness tracking over the last three years, there is a significant “clarity gap”. Currently, 44% of marketers disagree that marketing effectiveness is a well-defined function within their business. This uncertainty often leads to “short-termism” as brands retreat to the safety of immediate, easily measured metrics while neglecting the long-term drivers of growth.
To bridge this gap, Google and analytics firm Ekimetrics have developed a blueprint for securing growth in a high-pressure environment. By understanding the universal law of investment, marketers can shift from arbitrary budget caps to a demand-led strategy that captures every available unit of growth.
The law of the S-curve
The relationship between spend and revenue is not a straight line. It is governed by an S-shaped “saturation curve” where every dollar performs differently depending on where it sits on the curve:
- The horizontal axis shows “effort”. In a marketing context, this typically refers to inputs such as advertising spend, media activity level, or other indicators of media intensity.
- The vertical axis shows “gain”. This signifies the desired outcomes. Most commonly this refers to incremental sales or revenue in the short- or long term, but it can also be other key performance indicators, like brand awareness, website engagement, or lead generation.
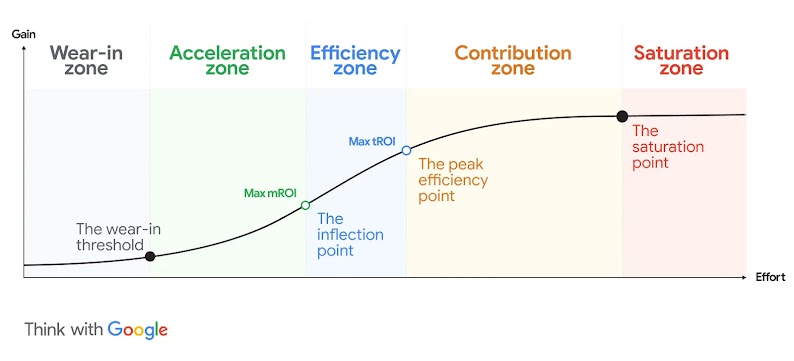
There are 5 critical “zones” on each saturation curve that show the impact of marketing spend:
- Wear-in zone: Revenue grows slower than spend due to initial friction, awareness building, and purchase cycle length. You are investing through the inefficiency to reach scale.
- Acceleration zone: You have crossed the break-even threshold. Every extra dollar now generates profit1 and efficiency is improving with every step. This is your steepest growth.
- Efficiency zone: You have passed the inflection point where marginal returns are starting to slow down (diminish), but they are still so high that they are pulling your total, average return-on-ad-spend (ROAS) upwards.
- Contribution zone: Total ROAS has peaked and is now declining, but every next dollar is still increasing revenue and profit. You accept lower efficiency to capture maximum market share and total revenue.
- Saturation zone: Diminishing returns are fully set in and the curve has flattened. The cost of the next sale is higher than the revenue it generates. Further spend destroys value. Stop immediately.
The saturation curve provides a dual lens for decision-makers, allowing for optimisation at two distinct levels. At the media channel level, it identifies which specific platforms have reached their limit and which have room to breathe.
At the total media budget level, it allows CMOs to look at the aggregate hero view of revenue — accounting for short-term, long-term, and brand equity impacts — to help optimise overall media investments.
Look beyond ROAS to maximise total revenue
While return-on-ad-spend continues to be very important for marketers, a common mistake is stopping overall investment at peak efficiency — the point where ROAS is at its absolute highest. While this looks great on a spreadsheet, it often leaves significant revenue on the table.
The goal should be to maximise ROAS at any given media spend level, meaning maximising incremental sales volume. This means pushing spending into the “Contribution zone”.
In this scenario, a slight decrease in overall ROAS is an indicator that spending in the “Contribution zone” is still growing the total volume of incremental sales. As long as the return remains above your profitability floor (where marginal ROAS > 1), the only rational financial decision is to keep investing.
A common mistake is stopping overall investment at peak efficiency
Brands are nowhere near hitting saturation
Our research with Ekimetrics shows that, despite the pressure to cut costs, most brands are nowhere near their “Saturation zone”. There is massive, untapped headroom for those willing to move to a demand-led model.
As an example, let’s take a look at the retail sector. According to our meta-analysis of marketing mix modelling (MMM) studies in Europe:
- The average retail brand showed potential headroom for top-line growth, with a theoretical capacity to increase media investment by up to 329% before reaching the saturation point (where marginal ROAS on turnover falls below 1).2
- In Search specifically, the average retail brand showed a theoretical capacity to increase investment by 830% before reaching the saturation point.3
There is massive, untapped headroom for those willing to move to a demand-led model
Know your growth potential
By mapping the specific marketing saturation curve of your organisation, you move from “guessing” your budget to “knowing” your growth potential. In an era where 42% of your peers are expecting to shrink their budgets, those who understand their curve are the ones who will capture the demand the rest of the market is leaving behind.
This concept is most evident in Search marketing. Investment here should be driven by real-time consumer intent rather than arbitrary, fixed budget caps. If your budget stops at 7PM but your customers are shopping until midnight, you aren’t saving money — you are funding your competitor’s growth.
A demand-led approach allows Google’s AI — like Performance Max and Demand Gen — to find high-value opportunities that a fixed, ROAS-obsessed budget would miss.
Don’t just navigate the curve — elevate it
One defining characteristic of a great marketer is not only the ability to find the optimal point on a static curve, but the vision to elevate it entirely.
While spending more moves you along the horizontal axis (potentially toward diminishing returns), strategic levers like creative quality and cross-channel synergy shift the entire curve upwards. This allows you to generate more sales for the exact same level of spend.
For example, our research shows that with the current level of media investment, advertisers in the retail vertical should have on average increased Search spend by 70% to maximise total ROAS in the short term.4
By mapping the specific marketing saturation curve of your organisation, you move from “guessing” your budget to “knowing” your growth potential
Success belongs to those who move beyond arbitrary budget caps to capture every unit of incremental revenue. Don’t just navigate the road; resurface it to allow for higher speeds, greater efficiency, and capturing the full growth potential of the market.
Ready to transform your marketing strategy?

Social Module
Share